| The questions on this page focus on: |
|
1. given a displacement graph.
|
|
2. given a velocity graph.
|
|
3. given an acceleration graph.
|
| Given displacement graph. |
1. .JPG)
(i) The particle started at 0.5 m (approx) to the left of the origin.
(ii) The particle is initially travelling to the left (i.e. in a negative direction) as the gradient is negative.
(iii) The particle has zero velocity at 1 and 4 secs
(derivative > 0).
(iv) The distance from S is greatest at approximately t = 4 (the maximum value).
(v) At t = 5, the acceleration (shown by the concavity of the graph) is negative so the particle is slowing down.
|
| |
2. 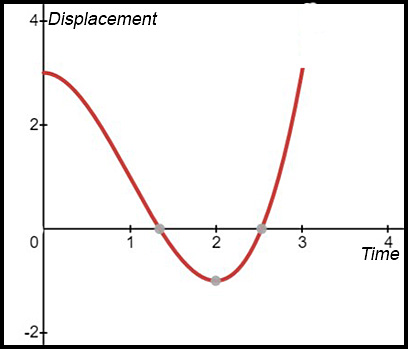
(i) At t = 0, displacement is 3 m to the right of the origin; zero velocity and negative acceleration.
(ii) At t = 0.5: displacement is about 2 m to the right (so particle has moved -1 m), it has negative velocity and negative acceleration.
(iii) At t = 1.5: displacement is just past the zero point (say at about -0.3 m) - displacement of -3.3 m, negative velocity and positive acceleration.
(iv) At t = 2.5: at the origin (so displacement is -3), positive velocity and positive acceleration.
|
| |
3. |
| |
4.  |
| |
5.  |
| Given velocity graph. |
6. 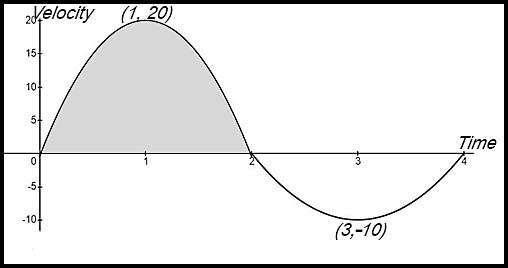
(i) The velocity of the particle after 1 second is 20 m/sec.
(ii) The acceleration of the particle after
3 seconds is 10 m/sec2 to the left?
(iii) The particle changes direction at t = 2 (when the velocity is zero)?
(iv)
| x |
0 |
1 |
2 |
3 |
4 |
| Vel |
0 |
20 |
0 |
-10 |
0 |
|
| |
7. 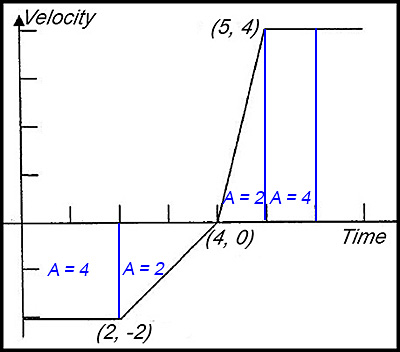
Initially the particle was at the origin.
(i) Area under the velocity-time curve gives the displacement. The diagram above shows the geometrical area of each component in blue. After 4 seconds the particle is 6 m to the left of the origin (i.e. in the negative direction) which is its furthest distance away.
(ii) The particle is back at the origin when the signed sum of these areas is zero - which is when t = 6 secs. After that, the particle continues to move forward for an additional second. After 7 seconds, the particle is therefore 4 m to the right of the origin?
(iii) 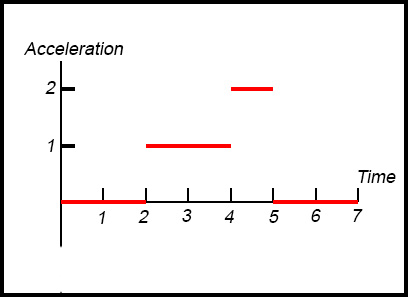
The constant velocities between t = 1 and t = 2 and between t = 5 and t = 7 imply zero acceleration.
The gradient of the increase in velocity between t = 2 and
t = 4 is 1 while the gradient between t = 4 and t = 5 is 2.
|
| |
8. 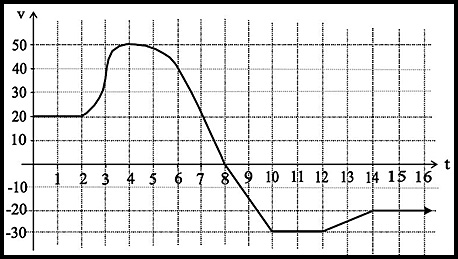
(i) In a velocity-time graph, acceleration is the gradient of the curve. Hence acceleration is greatest in the above graph at approximately t = 3.
(ii)
| t |
0 |
2 |
4 |
6 |
8 |
| v |
20 |
20 |
50 |
40 |
0 |
Area = 1×(20 + 0 + 2(20+50+40)) = 240 m
Total distance in the first 8 seconds is 240 m.
(iii) To return to the origin, distance in the first 8 seconds must be balanced by the (negative distance) in the period after the first 8 seconds for as long as it takes.
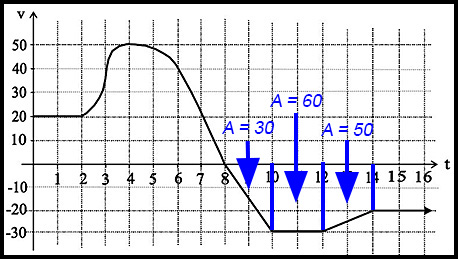
The diagram shows that the first three distances (i.e. areas) after 8 seconds are 30, 60 and 50 - so representing 140 m. We therefore need a further 100 m.
The width of the rectangle from 14 secs on is 20 so we need a further 5 seconds (20 × 5 = 100).
So the particle returns to its starting point after 18 seconds.
(iv) After the particle starts, it travels in a positive direction for 2 seconds at a constant velocity of 20 m/sec. It than accelerates for 2 seconds and reaches a velocity of 50 m/sec.
During the next 4 seconds (t = 4 to 8) it decelerates slowly and then more quickly (at about 20 m/sec after t = 6) until it is at rest at t = 8 secs although it is still travelling in the positive direction. It stops at a distance of 240 m from the start.
The particle then travels in the reverse direction increasing its speed at -15 m/sec2. It then travels at a constant speed of 30 m/sec for 2 seconds in the negative direction.
From t = 12 to t = 14, the particle decelerates in the negative direction at a constant deceleration of 5 m/sec in the positive direction. It then continues to travel in the negative direction at 20 m/sec until at t = 18 the particle is back at the starting point.
|
| |
9. 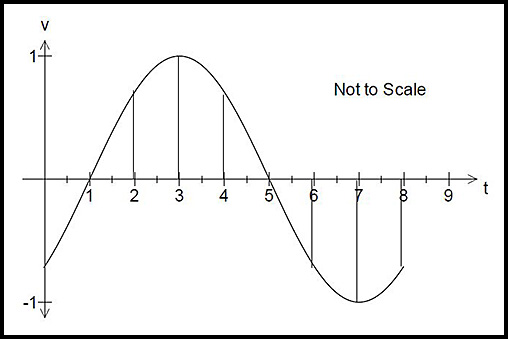
(i) the velocity is zero at t = 1 and at t = 5.
These are the points where the graph crosses the x axis.
(ii) the acceleration is zero at t = 3 and at t = 7.
These are the stationary points where the gradient of
the velocity-time graph
= 0.
(iii) The identification of the points of where the speed is increasing is difficult and needs reasoning slowly.
From t = 0 to 1, velocity is negative and the gradient is positive. Hence the particle
is slowing down while moving to the left. So its speed (a scalar quantity) is not increasing.
From t = 1 to t = 3, velocity and acceleration (gradient) are both positive. So the speed is increasing.
From t = 3 to t = 5, acceleration (gradient) is negative so the particle is slowing down from its positive speed.
From t = 5 to t = 7, the velocity is negative and the acceleration (gradient) is negative. Hence the particle is moving to the left and at an increasing speed.
From t = 7 to t = 8, the velocity is still negative but the acceleration (gradient) is now positive. So the speed in the negative direction is still decreasing but the particle is slowing down as it moves to the left. If that pattern were to continue, the particle would soon stop.
|
| |
10.
.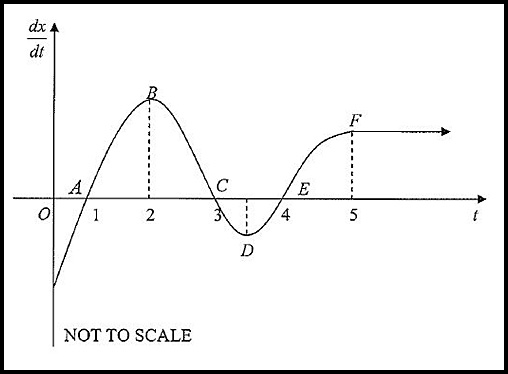
(i) The displacement of the object is decreasing for 0 < t < 1
(where the particle is moving to the left at a decreasing speed). Also the same situation for 3 < t < 4 (as the velocity is decreasing but the particle would be to the right of the starting point).
(ii) 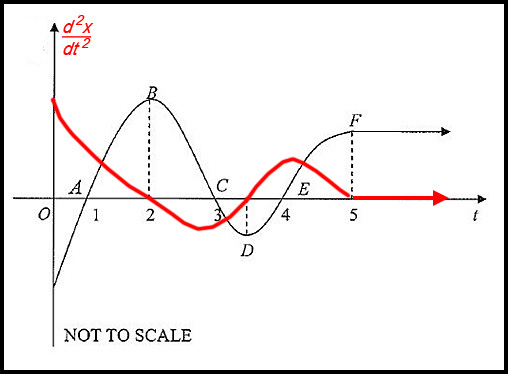
(iii) Distance travelled between t = 1 and t = 3:
Distance = 0.5(0 + 2×8 + 0) = 8 m
(iv) 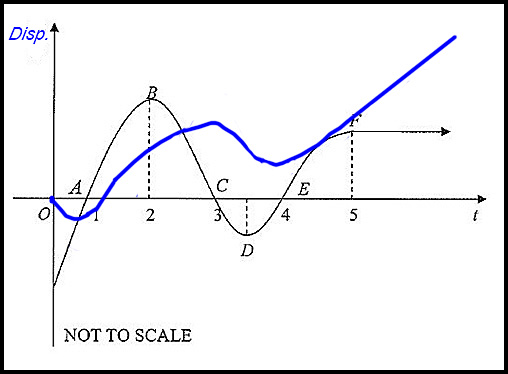
Note that there are minimums at t = A, C and E corresponding to the points where the velocity = 0.
Between t = o and t = 1 as well as between t = 3 and t = 4, velocity < 0 and hence the distance from the origin decreases.
Distance increases linearly beyond F because the velocity is a constant positive value (NOT = 0). |
| |
11. 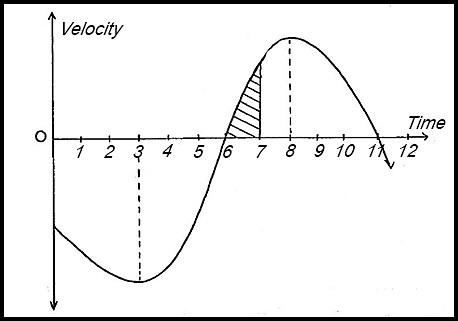
From the velocity-time graph above:
(i) The particle at rest at t = 6 and at t = 11.
(ii) The acceleration of the particle is zero t = 3 and at t = 8
(when the tangent to the velocity
curve has a gradient of zero).
(iii) The maximum acceleration of the particle occurs when the gradient of the velocity-time curve is at a maximum - so at about t = 5.
(iv) The shaded region represents the distance travelled by the particle between t = 6 and t = 7.
(v) The particle is further from its initial position at
t = 6 and not at t = 11.The area between the curve and the time axis from t = 0 to t = 6 is greater than the area from
t = 6 to t = 11. The former is a negative displacement and the latter is a positive. Hence the particle moves back further in the first 6 seconds than it moves forward in the next 5 seconds. At t = 11, it would not have returned to the origin.
|
| |
12. Below is the graph of a particle’s velocity v in m/sec plotted against time t in seconds. The particle’s motion lasts 10 seconds.
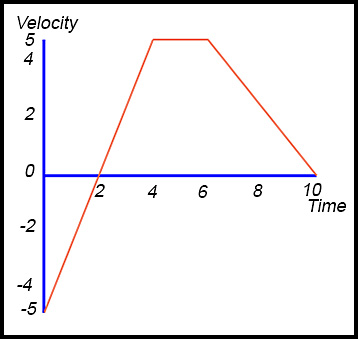
(i) The particle is at rest at t = 2 and t = 10.
(ii) Areat = 0 to 2 is -5
Areat = 2 to 4 is +5.
Hence the particle is back at the origin at t = 4 seconds.
(iii) Final displacement of the particle is given by the area from t = 4 to t = 10. Hence (using the trapezium) the particle has a displacement of 15 m.
(iv) Total distance travelled by the particle is
|-5| + 5 + 15 = 25 m.
|
| Given acceleration graph. |
13. 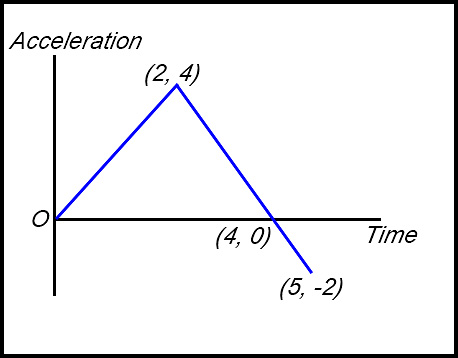
(i) The maximum acceleration of the particle is 4 m/sec2
at t = 2.
(ii) Maximum velocity from this graph is determined by the area between the curve and the time axis. Above the axis is positive.
Here the particle continues to accelerate in a positive direction for 4 seconds. Calculating the area of the triangle gives a maximum velocity of 8 m/sec2.
|
| |
14.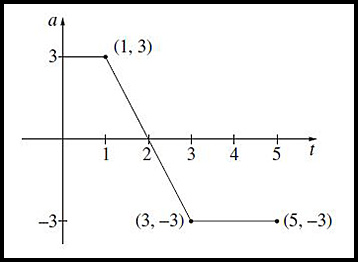
(i) The velocity of the particle is at a maximum at t = 2.
(ii) By calculating the respective areas between the function and the t axis, the velocity at t = 2 is 4.5 m/sec.
From t = 2 to t = 5, the velocity decreases by 7.5 m/sec.
Hence the final velocity at t = 5 is -3 m/sec.
(ii) The particle is furthest from the origin when the velocity equals 0. Balancing the areas above and below the t axis shows the furthest distance occurs when t = 4.
|
| |
15. |